Analyzing .NET managed code profile along with external code
I was helping someone analyze high CPU utilization of one of our services written in C#.
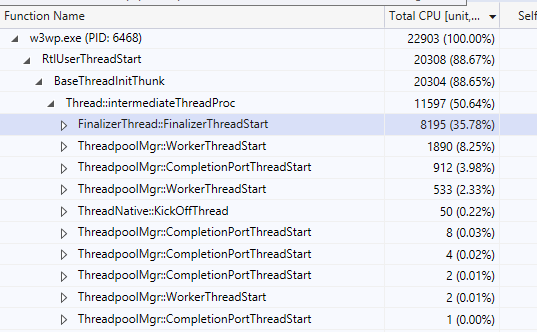
After they took the profile, we found that most of the time was being spent in [External Code].
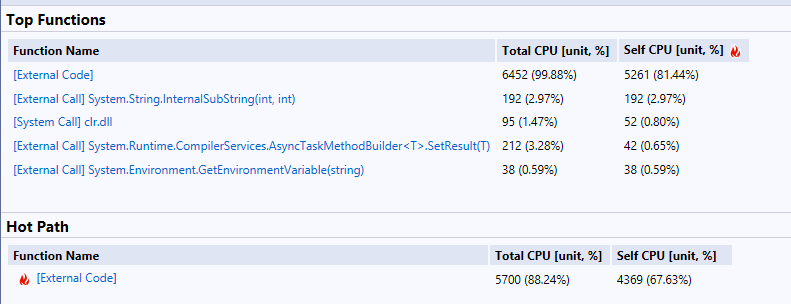
External code means that code is not part of your application. It is something your application depends on.
I faced this a few times and could never remember the set of steps to get to the details I needed. Always had to search online for the set of steps. Well, today I decided to document the step by step!
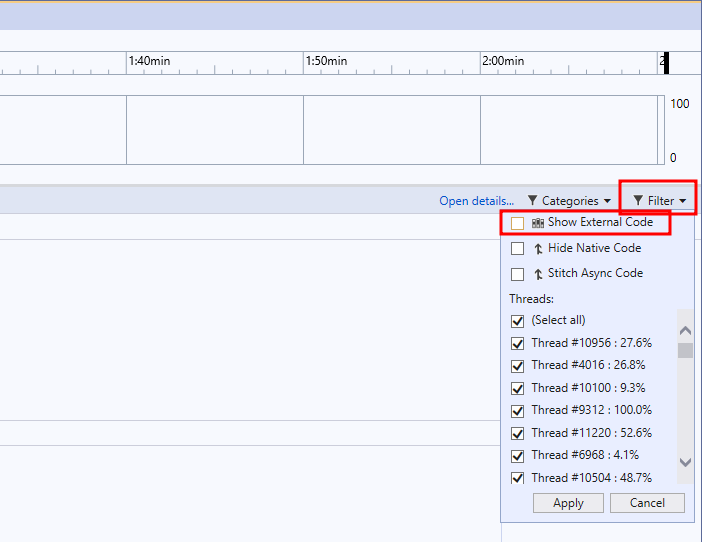
In Visual Studio, after opening the profile result file, on the right side of the main panel, you can toggle external code analysis.
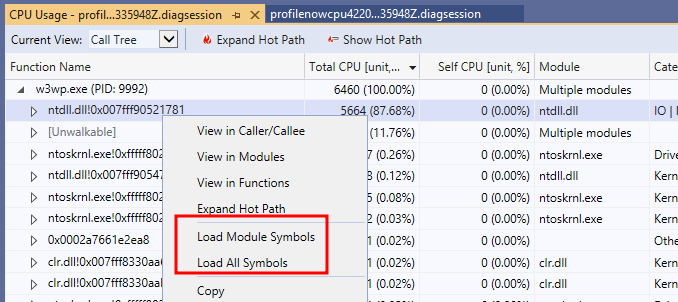
In our case, it showed that most of the time was spent on the kernel sys calls.
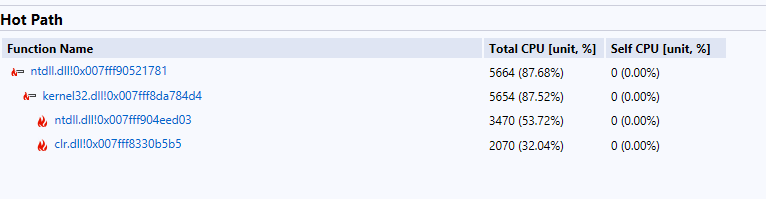
That helps - sort of. But then, how to figure out which are those calls?
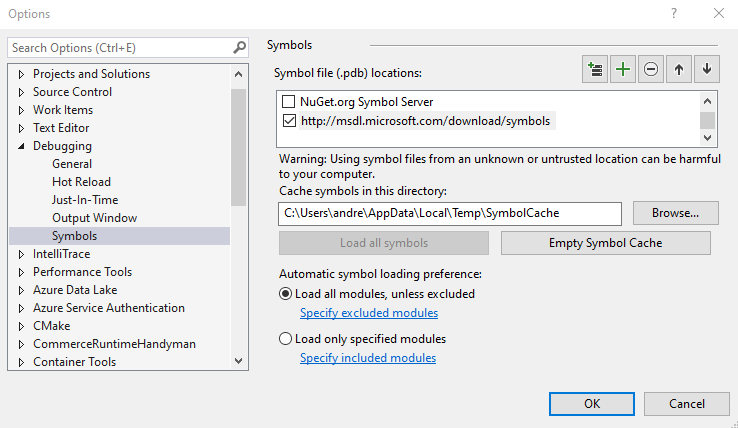
You can enable symbol loading from Microsoft’s symbol server by going to Debug -> Options -> Debugging -> Symbols and add a new entry there for http://msdl.microsoft.com/download/symbols
After that, you can right click -> Load Module Symbols from within the Call Tree panel.
After a while, Visual Studio will download the symbols from the server, and there we could see we had some sort of issue in how we were dealing with our threads start up and tear down.