The Qwen3.8 weight quantization ladder
This is a continuation from Measuring impact of KV quantization on Qwen3.8.
There I compared two weight quantizations (Q4/Q3) for Qwen3.8 27B, looked at their KLDs vs Q8 baseline. Those two weight quants were so far apart that I was curious to understand if the Q4 quant I am running was similarly far away from Q5, and whether it was worth upping the weight quant and dropping KV quantization further to compensate.
Here, I am testing a few variations of Q3 through Q5 weight quants from Unsloth, using the same methodology from the previous post. The caveat, again, is that the corpus I am testing with is prose/narrative heavy (not coding/STEM/tool calling), and limited to 20K context size.
Summary of results
- Holding KV dtype static, as expected, higher quant weights beat lower weight quants (see ladder below)
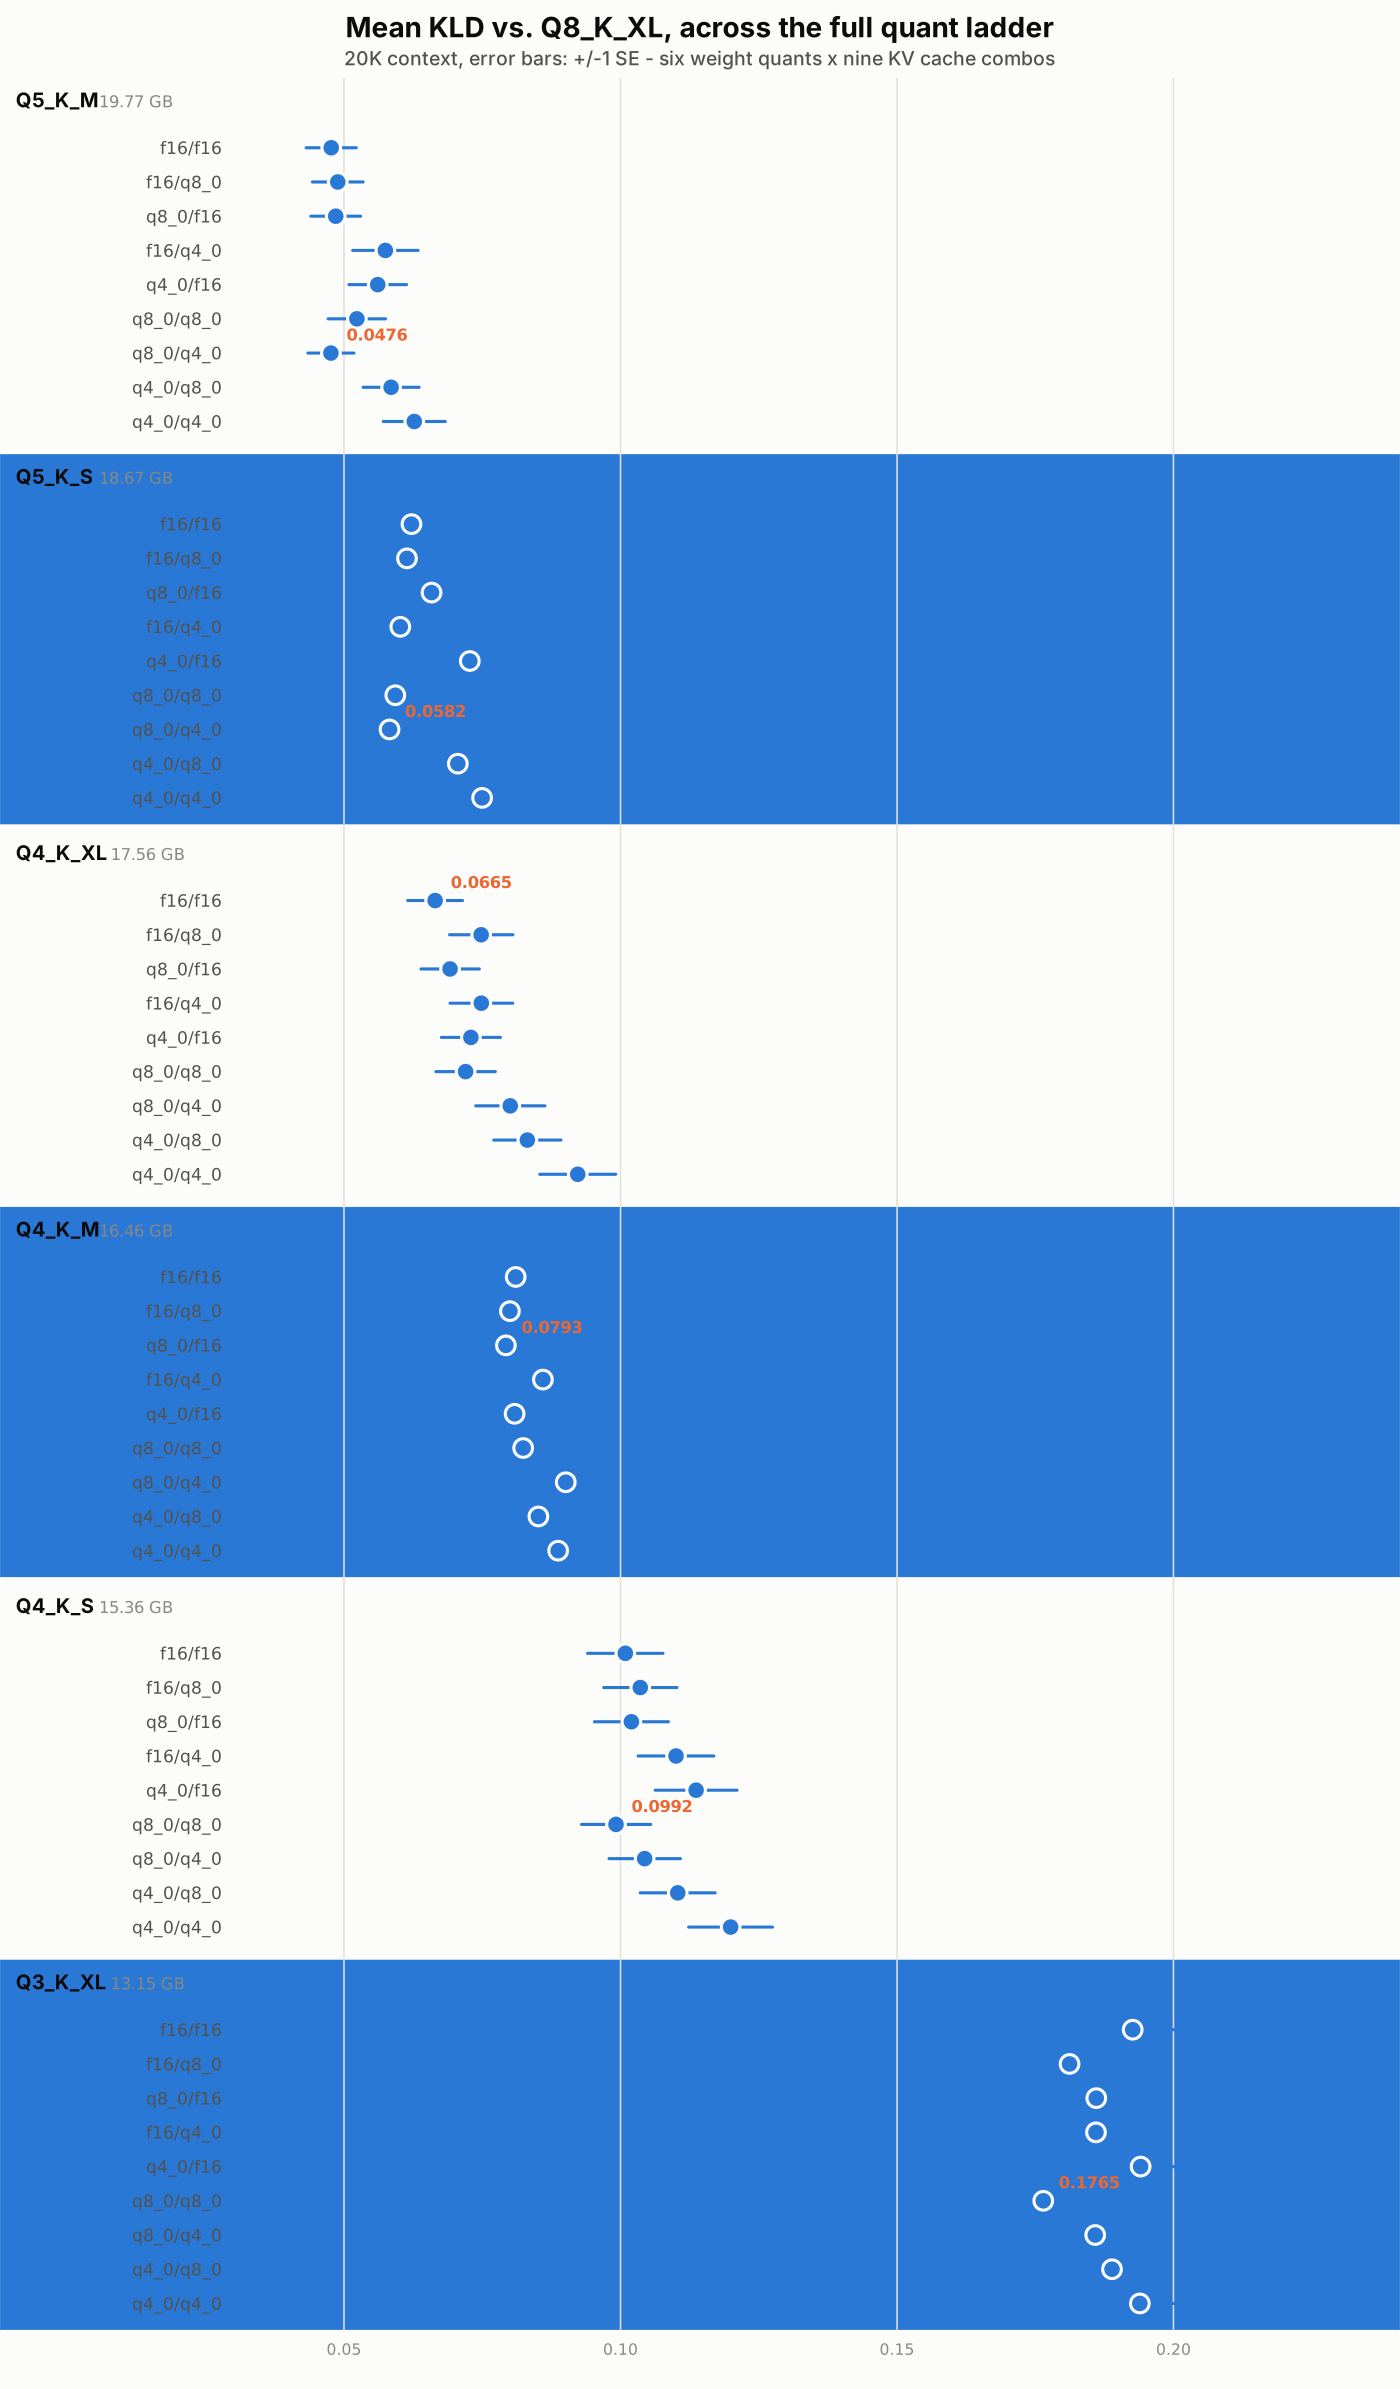
- Unsloth Q4_K_XL weight quantization is the inflection point. Moving up or down the weight quantization means accepting a less favorable KLD mean/VRAM improvement/regression ratio.
- There is no practical KV cache quantization that makes it worth moving the weight quant. For example, Q5_K_S weight quantization, even at Q4 KV cache dtype requires more VRAM and has worse KLD mean than running Q4_K_XL at F16.
- At 24GB VRAM, Q4_K_XL at Q8 dtype KV seems to be the sweet spot (in my opinion), given the saving on VRAM (allowing for bigger context window limits) and reasonable trade-off on the distance from the baseline model’s probability distribution (with all the caveats: narrative corpus, 20K context window test, measured against Q8 baseline).
Weight quantization comparison
Weight-only comparison (same F16/F16 cache dtype for the runs in the table below), ranked by ascending mean KLD against the Q8_K_XL reference:
| Quant | Size | Mean KLD | Median KLD | P99 KLD | Same top-1 |
|---|---|---|---|---|---|
| Q5_K_M | 19.77 GB | 0.0477 | 0.0051 | 0.633 | 93.95% |
| Q5_K_S | 18.67 GB | 0.0622 | 0.0066 | 1.000 | 93.20% |
| Q4_K_XL | 17.56 GB | 0.0665 | 0.0081 | 1.179 | 92.83% |
| Q4_K_M | 16.46 GB | 0.0811 | 0.0101 | 1.499 | 92.12% |
| Q4_K_S | 15.36 GB | 0.1009 | 0.0131 | 1.799 | 90.87% |
| Q3_K_XL | 13.15 GB | 0.1926 | 0.0246 | 3.703 | 88.23% |
Marginal cost per GB freed, moving down the ladder:
| step | VRAM savings (GB) | delta mean KLD | nats/GB |
|---|---|---|---|
| Q5_K_M -> Q5_K_S | 1.10 | +0.0145 | 0.0132 |
| Q5_K_S -> Q4_K_XL | 1.11 | +0.0043 | 0.0039 |
| Q4_K_XL -> Q4_K_M | 1.10 | +0.0146 | 0.0133 |
| Q4_K_M -> Q4_K_S | 1.10 | +0.0198 | 0.0180 |
| Q4_K_S -> Q3_K_XL | 2.21 | +0.0917 | 0.0415 |
Based on this, the answer to my original question is: no, not worth going from Q4_K_XL -> Q5_K_S for the extra 1GB VRAM cost. I’d rather deploy that into a larger context window. Going lower to Q4_K_M or below is also not enticing given the acceleration of the KLD mean movement.
Weight + KV quantization visualization
Claude generated these nice visualizations (thanks, Claude!).
Static image.
Bands are ordered top to bottom by fidelity; within each band, rows are the same nine K/V cache combinations in the same fixed order as the previous post’s tables, so a given cache setting sits at the same offset in every band. The x-axis is zoomed to the data range (it doesn’t start at zero) — this is a comparative point-range chart, not a bar chart, so a truncated axis doesn’t distort area the way it would on a bar. Hover (or tap) any point: it draws a guide line through it and colors every other point green (better) or red (worse) relative to it, and the tooltip includes an estimated total VRAM (weights + KV cache) for that exact config at 20K context.
Static image.
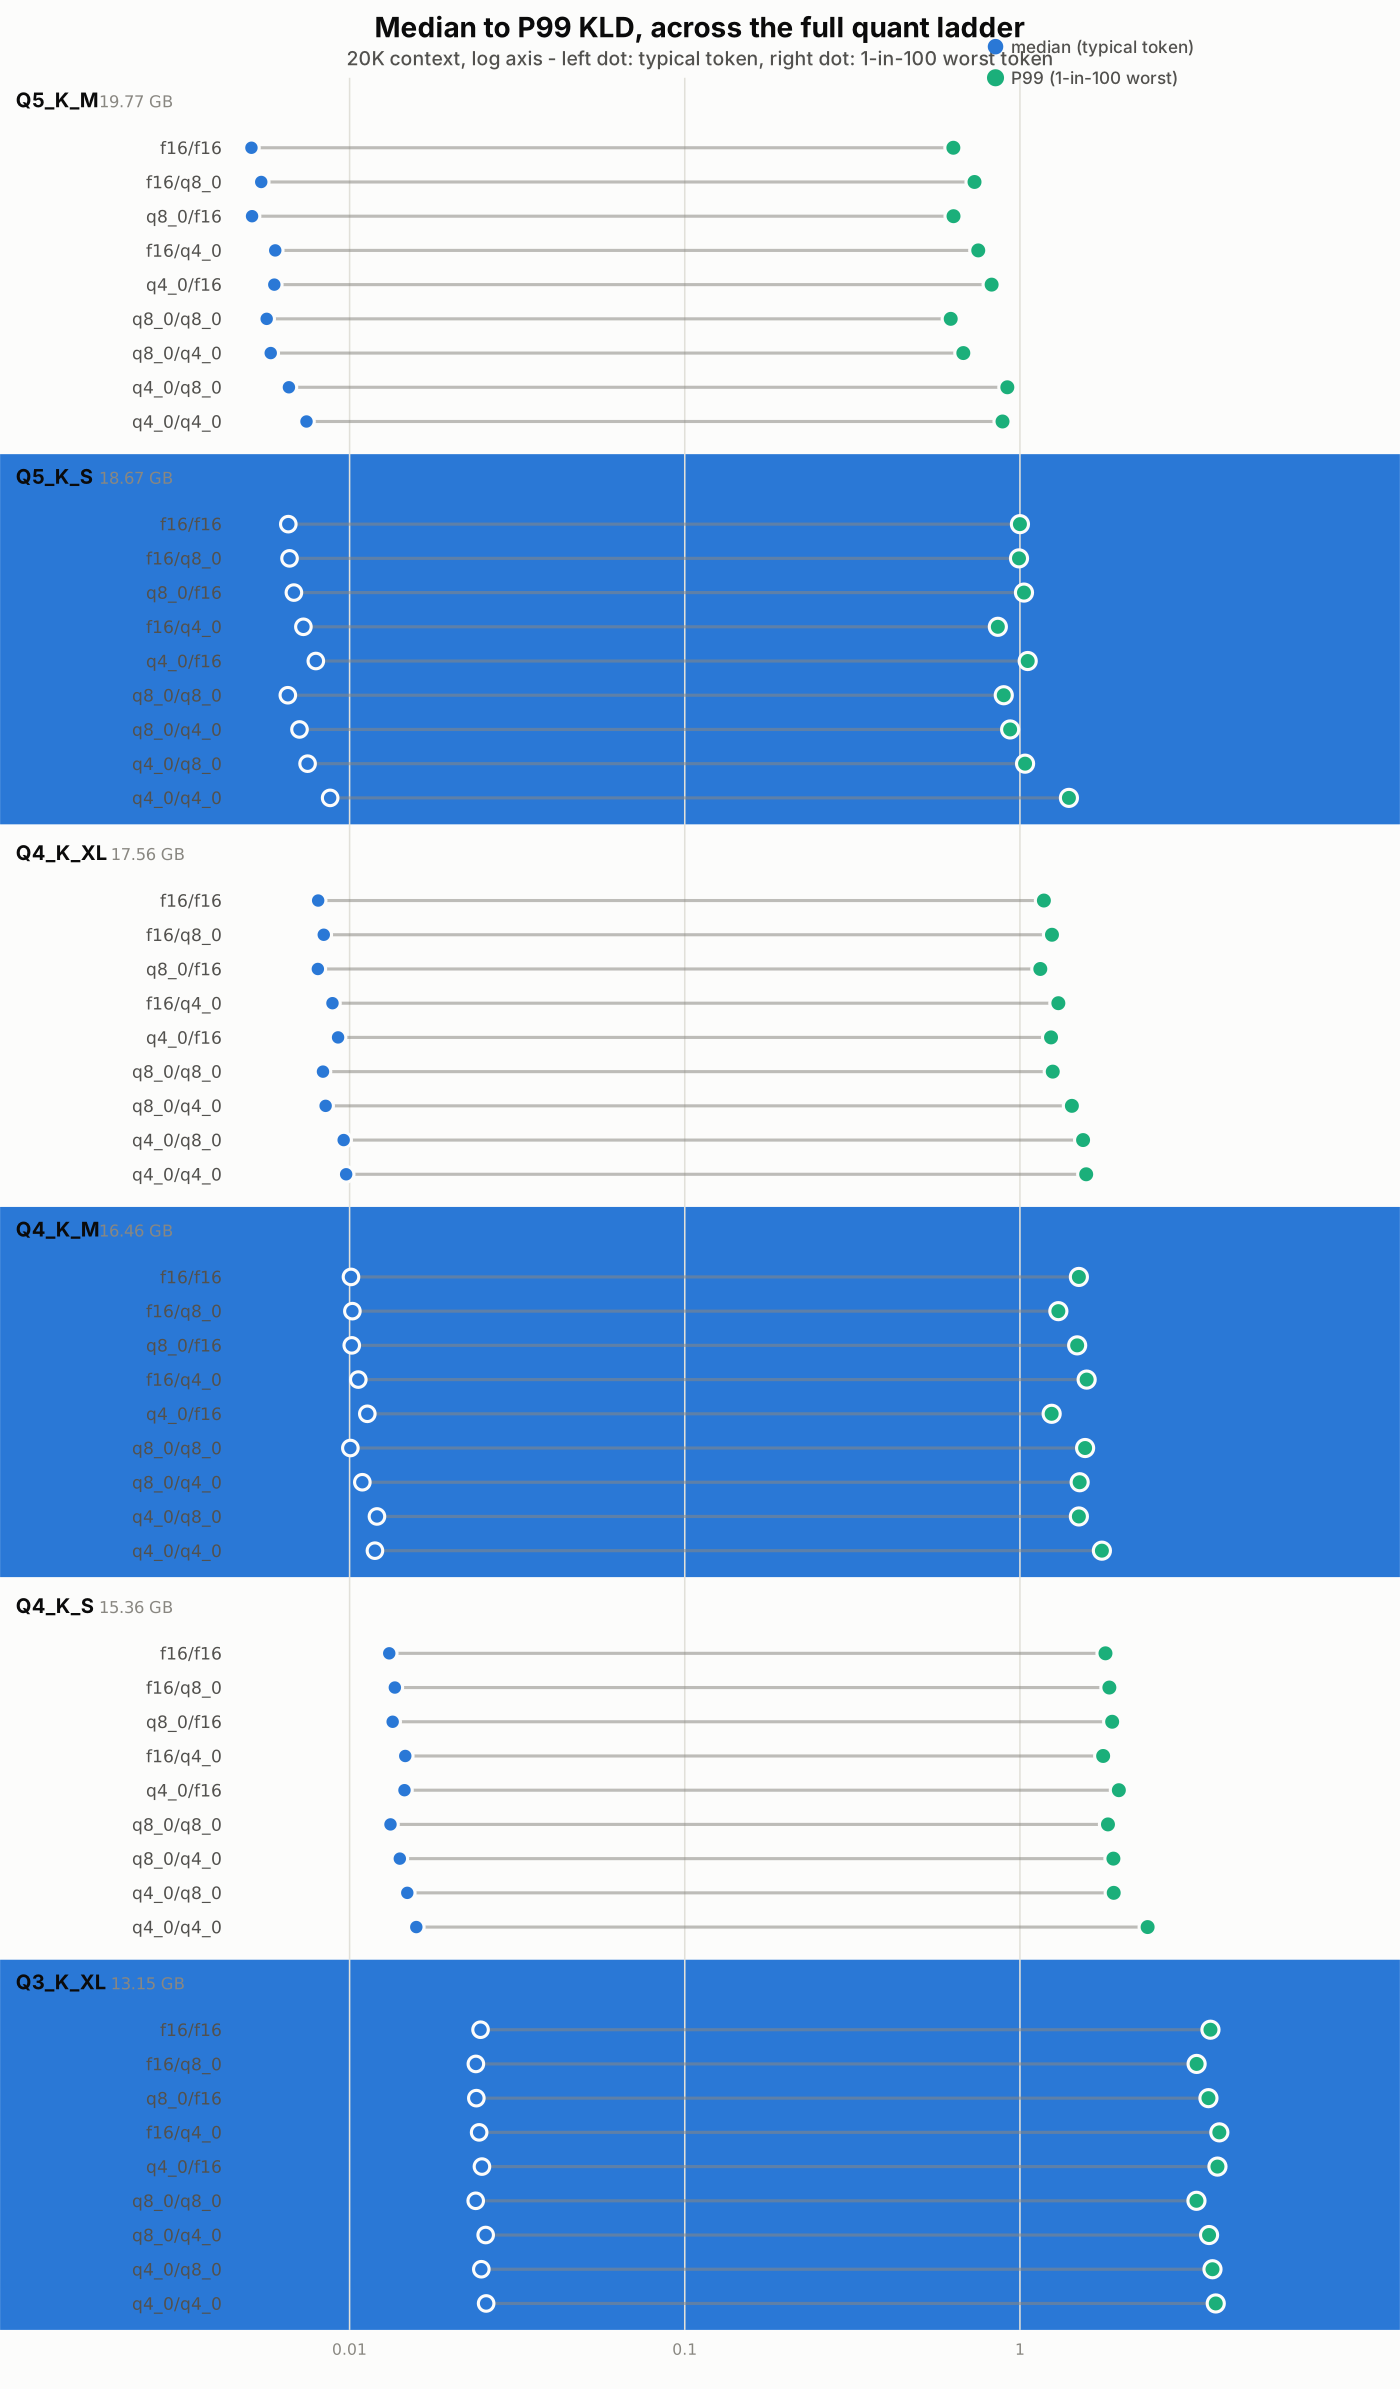
A long line between the two dots on a row means that config is fine most of the time but has a sharp catastrophic tail; a short line means the damage is spread evenly. Across the whole ladder the lines get longer going down (P99 grows faster than median), so the degradation from more aggressive weight quantization isn’t uniform blurring, it’s an increasingly heavy tail of near-total failures on a small fraction of tokens.
Full results
Q5_K_M vs Q8_K_XL (19.77 GB weights):
| K / V cache | KV (KiB/token) | mean KLD | median KLD | same top-1 | mean dp | RMS dp |
|---|---|---|---|---|---|---|
| f16 / f16 | 64 | 0.0477 | 0.0051 | 93.95% | -0.109% | 6.05% |
| f16 / q8 | 49 | 0.0489 | 0.0054 | 93.73% | +0.262% | 6.29% |
| q8 / f16 | 49 | 0.0485 | 0.0051 | 93.83% | -0.182% | 6.10% |
| f16 / q4 | 41 | 0.0575 | 0.0060 | 93.65% | -0.141% | 6.39% |
| q4 / f16 | 41 | 0.0561 | 0.0060 | 93.63% | -0.100% | 6.28% |
| q8 / q8 | 34 | 0.0523 | 0.0057 | 93.74% | +0.399% | 6.29% |
| q8 / q4 | 26 | 0.0476 | 0.0058 | 93.62% | +0.072% | 5.89% |
| q4 / q8 | 26 | 0.0585 | 0.0066 | 93.31% | +0.258% | 6.96% |
| q4 / q4 | 18 | 0.0627 | 0.0074 | 92.98% | +0.534% | 7.04% |
Q5_K_S vs Q8_K_XL (18.67 GB weights):
| K / V cache | KV (KiB/token) | mean KLD | median KLD | same top-1 | mean dp | RMS dp |
|---|---|---|---|---|---|---|
| f16 / f16 | 64 | 0.0622 | 0.0066 | 93.20% | -0.348% | 6.86% |
| f16 / q8 | 49 | 0.0614 | 0.0066 | 92.97% | -0.282% | 6.84% |
| q8 / f16 | 49 | 0.0658 | 0.0068 | 92.96% | -0.612% | 7.12% |
| f16 / q4 | 41 | 0.0602 | 0.0073 | 92.91% | -0.470% | 6.81% |
| q4 / f16 | 41 | 0.0728 | 0.0079 | 92.69% | -0.442% | 7.39% |
| q8 / q8 | 34 | 0.0593 | 0.0065 | 93.03% | -0.338% | 6.83% |
| q8 / q4 | 26 | 0.0582 | 0.0071 | 92.92% | -0.185% | 6.81% |
| q4 / q8 | 26 | 0.0706 | 0.0075 | 92.64% | +0.048% | 7.09% |
| q4 / q4 | 18 | 0.0750 | 0.0087 | 92.32% | -0.680% | 7.66% |
Q4_K_XL vs Q8_K_XL (17.56 GB weights, see previous post for K/V cache table):
| K / V cache | KV (KiB/token) | mean KLD | median KLD | same top-1 | mean dp | RMS dp |
|---|---|---|---|---|---|---|
| f16 / f16 | 64 | 0.0665 | 0.0081 | 92.83% | -0.191% | 7.35% |
| f16 / q8 | 49 | 0.0748 | 0.0084 | 92.80% | +0.363% | 7.18% |
| q8 / f16 | 49 | 0.0692 | 0.0080 | 92.86% | +0.049% | 7.25% |
| f16 / q4 | 41 | 0.0748 | 0.0089 | 92.37% | +0.231% | 7.35% |
| q4 / f16 | 41 | 0.0729 | 0.0092 | 92.61% | +0.013% | 7.22% |
| q8 / q8 | 34 | 0.0720 | 0.0083 | 93.00% | +0.266% | 7.59% |
| q8 / q4 | 26 | 0.0801 | 0.0085 | 92.78% | -0.011% | 7.42% |
| q4 / q8 | 26 | 0.0832 | 0.0096 | 92.17% | +0.226% | 7.96% |
| q4 / q4 | 18 | 0.0923 | 0.0098 | 91.94% | +0.201% | 8.11% |
Q4_K_M vs Q8_K_XL (16.46 GB weights):
| K / V cache | KV (KiB/token) | mean KLD | median KLD | same top-1 | mean dp | RMS dp |
|---|---|---|---|---|---|---|
| f16 / f16 | 64 | 0.0811 | 0.0101 | 92.12% | -0.560% | 7.93% |
| f16 / q8 | 49 | 0.0800 | 0.0102 | 91.90% | -0.347% | 7.88% |
| q8 / f16 | 49 | 0.0793 | 0.0101 | 92.02% | -0.319% | 8.06% |
| f16 / q4 | 41 | 0.0860 | 0.0106 | 91.88% | -0.363% | 7.90% |
| q4 / f16 | 41 | 0.0808 | 0.0113 | 91.41% | -0.270% | 7.95% |
| q8 / q8 | 34 | 0.0824 | 0.0100 | 91.66% | -0.367% | 8.18% |
| q8 / q4 | 26 | 0.0901 | 0.0109 | 91.52% | -0.569% | 8.01% |
| q4 / q8 | 26 | 0.0852 | 0.0121 | 91.14% | -0.470% | 8.24% |
| q4 / q4 | 18 | 0.0887 | 0.0119 | 91.17% | -0.504% | 8.54% |
Q4_K_S vs Q8_K_XL (15.36 GB weights):
| K / V cache | KV (KiB/token) | mean KLD | median KLD | same top-1 | mean dp | RMS dp |
|---|---|---|---|---|---|---|
| f16 / f16 | 64 | 0.1009 | 0.0131 | 90.87% | -0.514% | 8.46% |
| f16 / q8 | 49 | 0.1036 | 0.0136 | 90.78% | -0.486% | 8.64% |
| q8 / f16 | 49 | 0.1020 | 0.0134 | 90.87% | -0.566% | 8.51% |
| f16 / q4 | 41 | 0.1100 | 0.0147 | 90.45% | -0.725% | 8.95% |
| q4 / f16 | 41 | 0.1137 | 0.0146 | 90.41% | -0.581% | 9.05% |
| q8 / q8 | 34 | 0.0992 | 0.0132 | 90.89% | -0.330% | 8.51% |
| q8 / q4 | 26 | 0.1044 | 0.0141 | 90.67% | -0.457% | 8.77% |
| q4 / q8 | 26 | 0.1104 | 0.0149 | 90.01% | -0.282% | 8.97% |
| q4 / q4 | 18 | 0.1199 | 0.0158 | 90.31% | -0.627% | 9.22% |
Q3_K_XL vs Q8_K_XL (13.15 GB weights, see previous post for K/V cache table):
| K / V cache | KV (KiB/token) | mean KLD | median KLD | same top-1 | mean dp | RMS dp |
|---|---|---|---|---|---|---|
| f16 / f16 | 64 | 0.1926 | 0.0246 | 88.23% | -1.275% | 11.59% |
| f16 / q8 | 49 | 0.1812 | 0.0238 | 88.27% | -1.169% | 11.47% |
| q8 / f16 | 49 | 0.1860 | 0.0239 | 88.32% | -1.039% | 11.53% |
| f16 / q4 | 41 | 0.1860 | 0.0244 | 88.05% | -1.198% | 11.58% |
| q4 / f16 | 41 | 0.1940 | 0.0248 | 87.82% | -1.078% | 11.85% |
| q8 / q8 | 34 | 0.1765 | 0.0238 | 88.46% | -0.950% | 11.29% |
| q8 / q4 | 26 | 0.1858 | 0.0255 | 88.23% | -1.420% | 11.64% |
| q4 / q8 | 26 | 0.1889 | 0.0247 | 87.85% | -1.280% | 11.58% |
| q4 / q4 | 18 | 0.1939 | 0.0256 | 87.64% | -1.330% | 11.72% |
Limitations
Same as the previous post (check for details): prose/narrative corpus (results on STEM/code may differ), 20K context only, no qualitative assessment, not benchmarked against known answers.
What next
- Repeat at 90K context (the close to max context window I can run on 24GB VRAM with Q4_K_XL)